In the previous article, PowerShell downloaded Palmer Penguins data, built a Vega-Lite specification, and saved the resulting HTML as a report. Nothing in that approach was specific to a notebook: Show-VegaLite returned HTML, and Set-Content decided where it went.
A notebook can consume the same HTML instead:
$spec |
    Show-VegaLite |
    Display -MimeType 'text/x-verso-widget'
That small change gives the output a place beside the code and explanation that produced it. The output can be saved with the notebook, inspected later, and regenerated after changing a parameter or refreshing the data.
This article looks at a larger example: the Deneb Showcase PowerShell notebook included with Verso. It contains 29 cells and ten saved Vega or Vega-Lite visualizations backed by public datasets.

The online Viewer is read-only. It displays the saved outputs, but it does not execute PowerShell or refresh the remote datasets.
From a report to a notebook cell
The standalone report and the notebook share the same central idea:
PowerShell objects
    → Vega or Vega-Lite specification
    → HTML containing Vega-Embed
    → a destination chosen by the caller
For a file, the destination is Set-Content. Verso uses its rich display pipeline:
$html | Display -MimeType 'text/x-verso-widget'
The Deneb Showcase predates the factored version from the first article, so its helper performs this final Display inside Show-DenebSpec. That keeps notebook cells short:
$calendarTemplate |
    Set-WeatherCalendarYear -Weather $irvineWeather -Year $year -Metric $metric |
    Show-VegaLite
The architectural boundary is still the same. Show-DenebSpec builds an HTML document, and the final line sends that document to Verso:
$document | Display -MimeType 'text/x-verso-widget'
If we reuse the pipeline-oriented function from the report article, that last decision moves back to the cell:
$calendarTemplate |
    Set-WeatherCalendarYear -Weather $irvineWeather -Year $year -Metric $metric |
    Show-VegaLite |
    Display -MimeType 'text/x-verso-widget'
This is the version I prefer for reusable scripts: the renderer produces HTML, while the host decides how to display or persist it.
What the notebook contains
The notebook is not ten hand-written datasets embedded in chart specifications. It separates four responsibilities:
- Download a pinned Vega or Vega-Lite template adapted from the Deneb Showcase.
- Download and validate current data from a public source.
- Transform that data into the shape expected by the template without mutating the original specification.
- Render the resulting specification as a Verso widget.
helper.ps1 provides the common pipeline commands:
Get-DenebShowcaseSpecdownloads a pinned specification.Set-DenebSpecDatareplaces inline or named data sources on a copy.Set-DenebSpecSizechanges explicit dimensions without rewriting the chart.Show-VegaandShow-VegaLiteselect the correct grammar and renderer.
Dataset-specific scripts handle Open-Meteo, SIPRI, Microsoft financial statements, FDIC bank failures, Wikidata, MusicBrainz, the World Bank, the NASA Exoplanet Archive, and NESO electricity-generation data.
Most examples deliberately use two cells. The first downloads and validates a dataset; the second selects a period or filter and renders it. You can change a year or a Top N value repeatedly without downloading the source again.
Calendar heatmap: one parameter, another view
The weather example downloads Irvine daily observations once and exposes the available years and missing-value counts. The display cell then chooses a year and metric:
$year = (Get-Date).Year
$metric = 'Temperature' # Or 'Precipitation'

$calendarTemplate |
    Set-WeatherCalendarYear -Weather $irvineWeather -Year $year -Metric $metric |
    Show-VegaLite
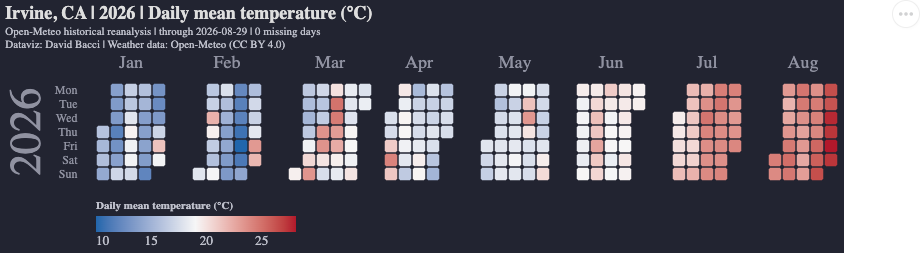
The saved output is a snapshot. Rerunning the download cell can extend the current year, while rerunning only the display cell reuses the data already held by the PowerShell kernel.
Relationship data as a force-directed graph
Vega is not limited to statistical charts. One notebook cell queries MusicBrainz for shared and former members of several bands, including Ария and Кипелов, then binds the returned nodes and edges to a force-directed graph.
$musicTemplate |
    Set-DenebRelationshipGraph -Graph $musicConnections |
    Show-Vega -Renderer canvas
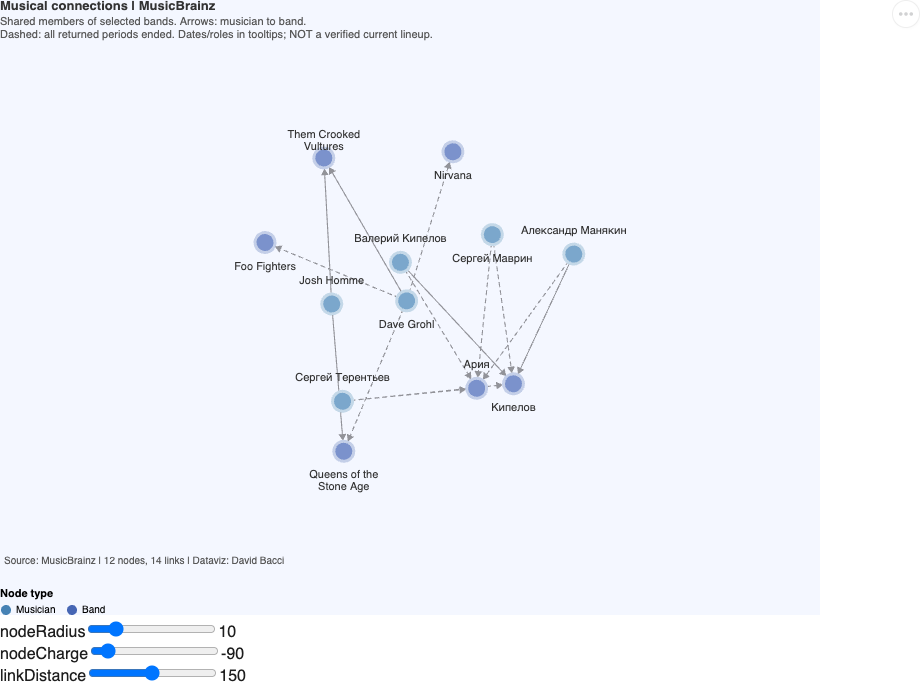
The qualifiers matter as much as the picture. Dashed links mean that all returned membership periods ended; the graph is not presented as a verified current lineup. Dates and instruments remain available in tooltips.
This is a useful notebook pattern for operational data too: collect relationships with PowerShell, retain their provenance, and use the graph as a navigable view rather than treating it as the source of truth.
Saved output can still be interactive
The World Bank example is a population bar-chart race. PowerShell downloads the time series, checks completeness, selects a period and region, and binds the selected economies to the template:
$startYear = 1960
$endYear = $worldPopulation.LatestYear
$topN = 12
$region = 'All'
$secondsPerYear = 0.6

$populationTemplate |
    Set-WorldBankPopulationRace `
        -Population $worldPopulation `
        -StartYear $startYear `
        -EndYear $endYear `
        -TopN $topN `
        -Region $region `
        -SecondsPerYear $secondsPerYear |
    Show-Vega -Renderer canvas
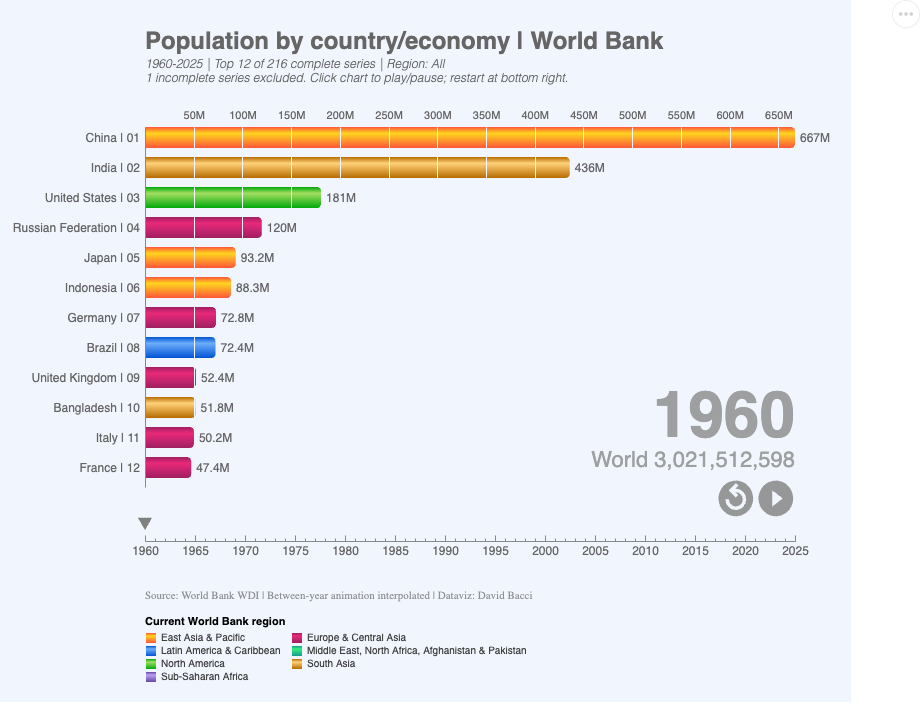
The notebook saves the HTML widget, including its specification and selected data. The Viewer can therefore display the chart and its controls without starting a PowerShell kernel. It still loads the pinned Vega JavaScript runtimes from jsDelivr, so saved does not mean completely offline.
Vega-Lite works through the same path
The final example downloads the latest completed half-hour intervals from NESO and renders the Great Britain generation mix as nine waffle panels:
$intervalStartUtc = $gbGeneration.LatestFromUtc

$electricityTemplate |
    Set-GbGenerationWaffle -Mix $gbGeneration -FromUtc $intervalStartUtc |
    Show-VegaLite -Renderer canvas
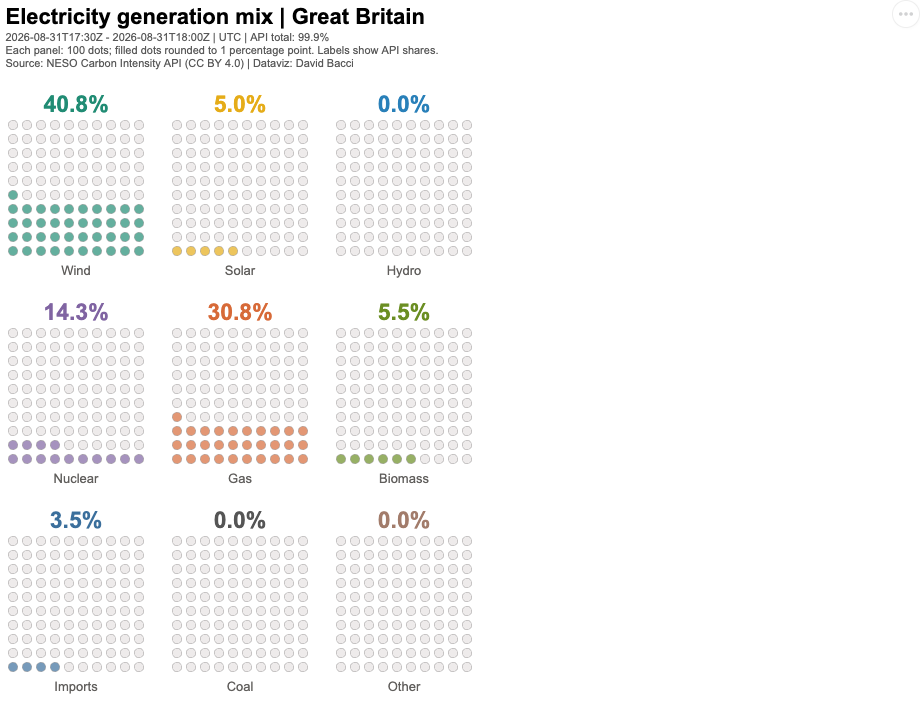
Each panel contains 100 dots. Filled dots are rounded to one percentage point, while the labels retain the API values. The notebook also reports missing intervals instead of silently pretending that an incomplete response is complete.
Why keep the data adapters outside the notebook?
A notebook becomes difficult to maintain when every cell contains downloading, parsing, validation, transformation, visualization, and presentation code at once. The Showcase keeps reusable work in adjacent .ps1 files and leaves the cells focused on the narrative:
#!import ./gb-electricity.ps1

$electricityTemplate = Get-DenebShowcaseSpec 'Waffle Charts/Spec.json'
$gbGeneration = Get-GbGenerationMix -Hours 48
This provides several practical benefits:
- functions can be tested without launching the notebook UI;
- source-specific caveats stay close to the parsing code;
- display cells remain short enough to explain;
- a fresh kernel can reconstruct state by rerunning imports and downloads;
- the same adapter can later feed an HTML report, another notebook, or a scheduled job.
The .verso file still owns the sequence, prose, parameters, and saved outputs. The scripts own reusable behavior.
Running and sharing the notebook
To run the sample locally, clone Verso and open:
samples/notebooks/powershell/deneb-showcase/deneb-showcase.verso
Keep the adjacent .ps1 files with it so the relative #!import directives resolve. The notebook needs internet access to refresh its datasets and to load the pinned Vega runtimes. It does not require API keys or additional PowerShell modules.
After a kernel restart, saved outputs remain visible, but PowerShell variables do not. Rerun the helper import, the relevant download cell, and then the display cell before changing parameters.
For readers who only want to inspect the result, use the Verso Viewer. The Viewer opens the version currently on main; a commit-pinned Viewer URL can be used when an immutable snapshot is required.
The useful boundary
Vega and Vega-Lite do not require a notebook, and Verso does not require chart-specific PowerShell objects. The useful boundary is simply HTML:
# A file report
$spec | Show-VegaLite | Set-Content ./report.html -Encoding utf8

# A Verso cell
$spec | Show-VegaLite | Display -MimeType 'text/x-verso-widget'
The first form creates a portable artifact for a ticket, build, or static site. The second preserves the analysis around that artifact and makes iteration immediate. PowerShell prepares the data in both cases; Vega describes the visualization in both cases; only the final destination changes.